Zwiftalizer 2.0 Released
Zwiftalier 2.0 is now live. It is a complete rewrite and includes an updated log parser, benchmarks reports and a web based ping test. Here a summary of the new features:
- System Specs
- Graphics profile
- Graphics vendor/model match (true/false)
- Platform/Device (PC, Mac, iOS, Android)
- BLE client type (local or Companion App)
- BLE device pairings
- ANT+ device pairings
- ANT+ device manufacturer and model lookup
- Loading time
- Game client version
- Game client version out of date warning
- Game Launcher version
- ISO 8601 date format
- User timezone (based on browser used to upload)
- Date and times converted to UTC server side
- Partition log session into multiple activities
- Data series per activity:
- World
- Start time
- End time
- Duration
- BLE disconnects
- ANT+ disconnects
- ANT+ message failures per channel
- FPS (min, max, avg, 1st percentile)
- World clock offsets
- Latency test failures
- Network TCP disconnects
- Network UDP disconnects
- Network UDP Server to Client packet count
- Network UDP Server to Client packet failures
- Network UDP Client to Server packet count
- Network UDP Client to Server packet failures
- Sharing log reports with permalinks
- Benchmarks Report
- Filter by World
- Filter by Profile
- Filter by Resolution
- Top 100 results ordered by average FPS descending
- Permalink to a report for World, Profile, Resolution
- Click on an entry to see top 100 activities for that system
Why now?
As we head into 2022, there’s a renewed interest in CPU and GPU performance for Zwift and renewed motivation on my part to modernize the site and keep it going. The driving factors for this include the continued GPU shortages and hyperinflated prices, Makuri Islands’ inexplicable high demands on PC resources, and Apple’s industry-changing ARM-based M1 chip designs.
Rebuilt for another five years
I felt it was time to rebuild Zwiftalizer.com from the ground up. The parser code in version one ran in the browser. This made it challenging to test on all browser and OS variants. Version two moves the heavy lifting to the server-side, and the code is now highly modular, which makes it easier to work on each component in isolation without introducing side effects in another.
It’s an easier maintenance model but it brings some new considerations such as data privacy and security compliance, and higher running costs because I have to store and process the data server-side. This requires consent from end-users. Everybody who uploads a log file must now sign in. This re-platforming will enable Zwiftalizer to keep going for another five years.
Multiple Activities
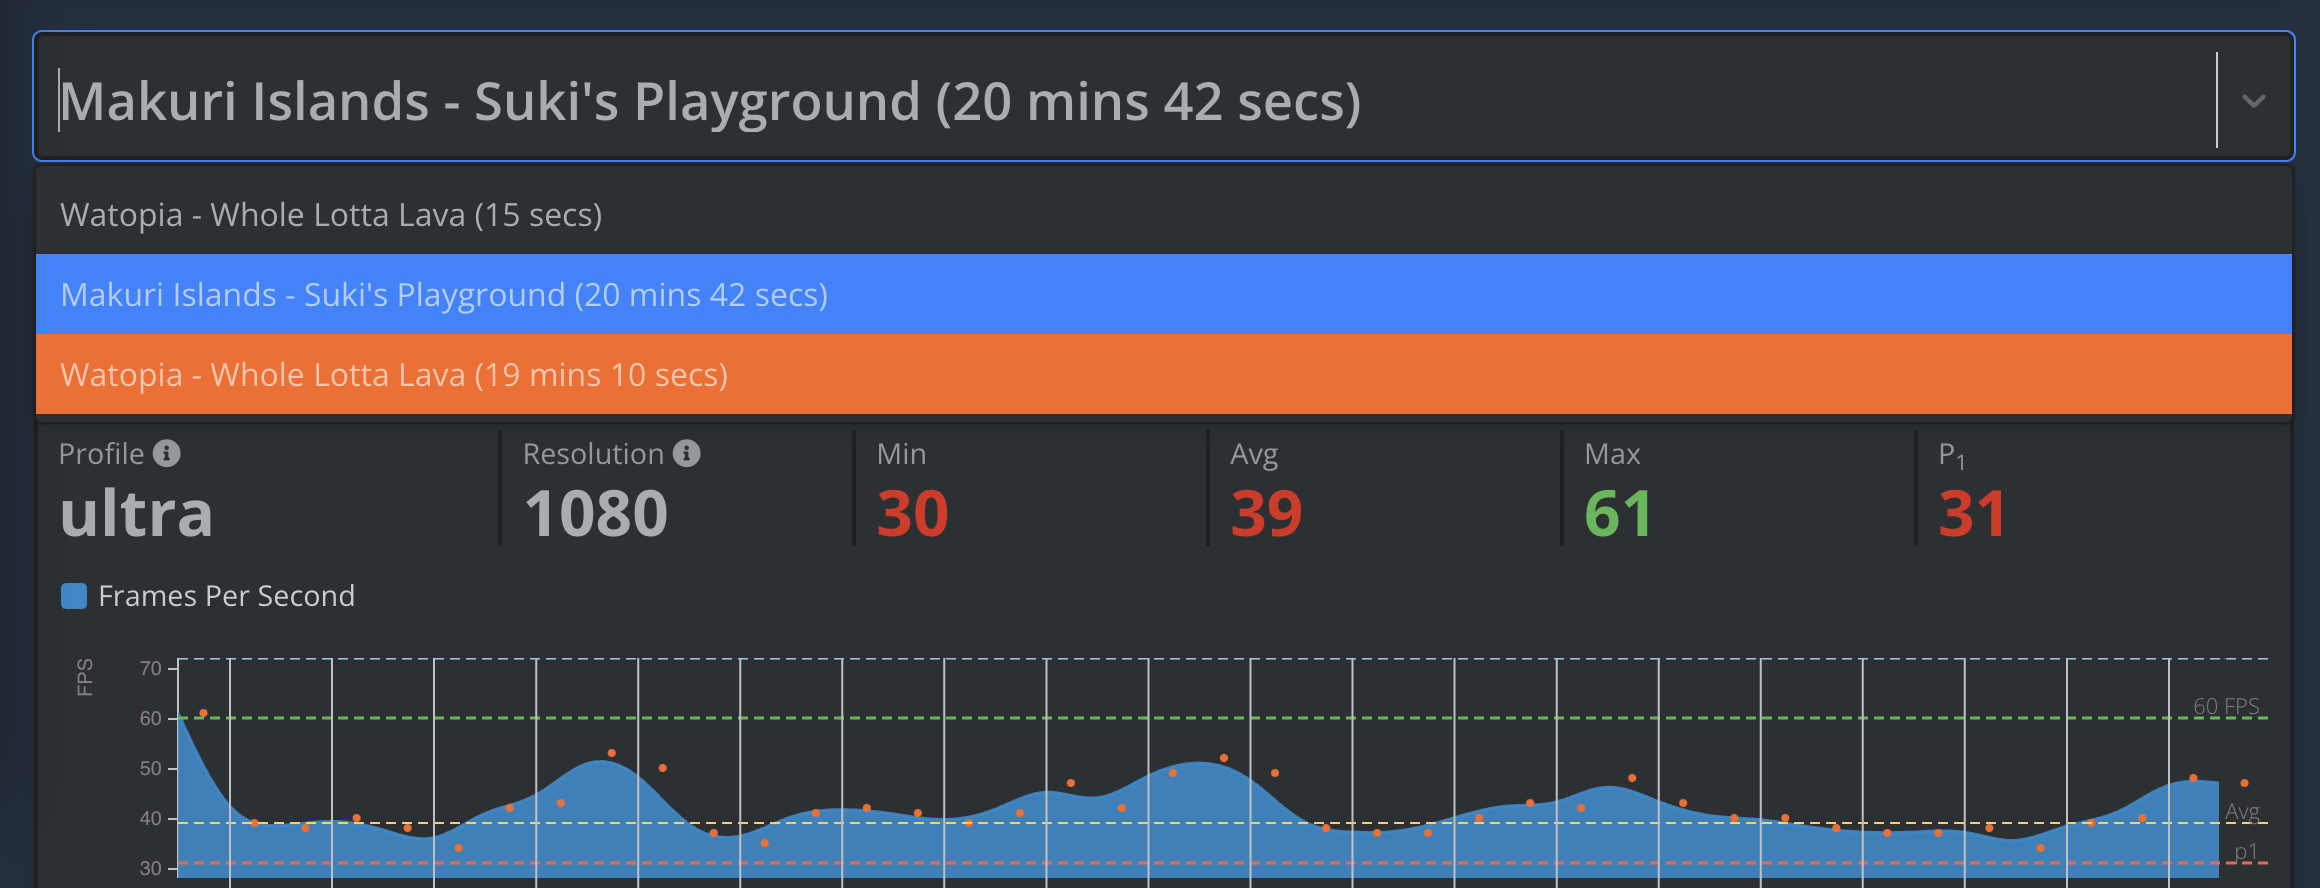
The biggest change in version 2.0 is that a log file is now divided into activities. This means that if you start a new ride (or run) without exiting, the parser will break up the log file and render charts for each activity. A drop-down menu allows you to flip between activities in the same session.
Log report Sharing
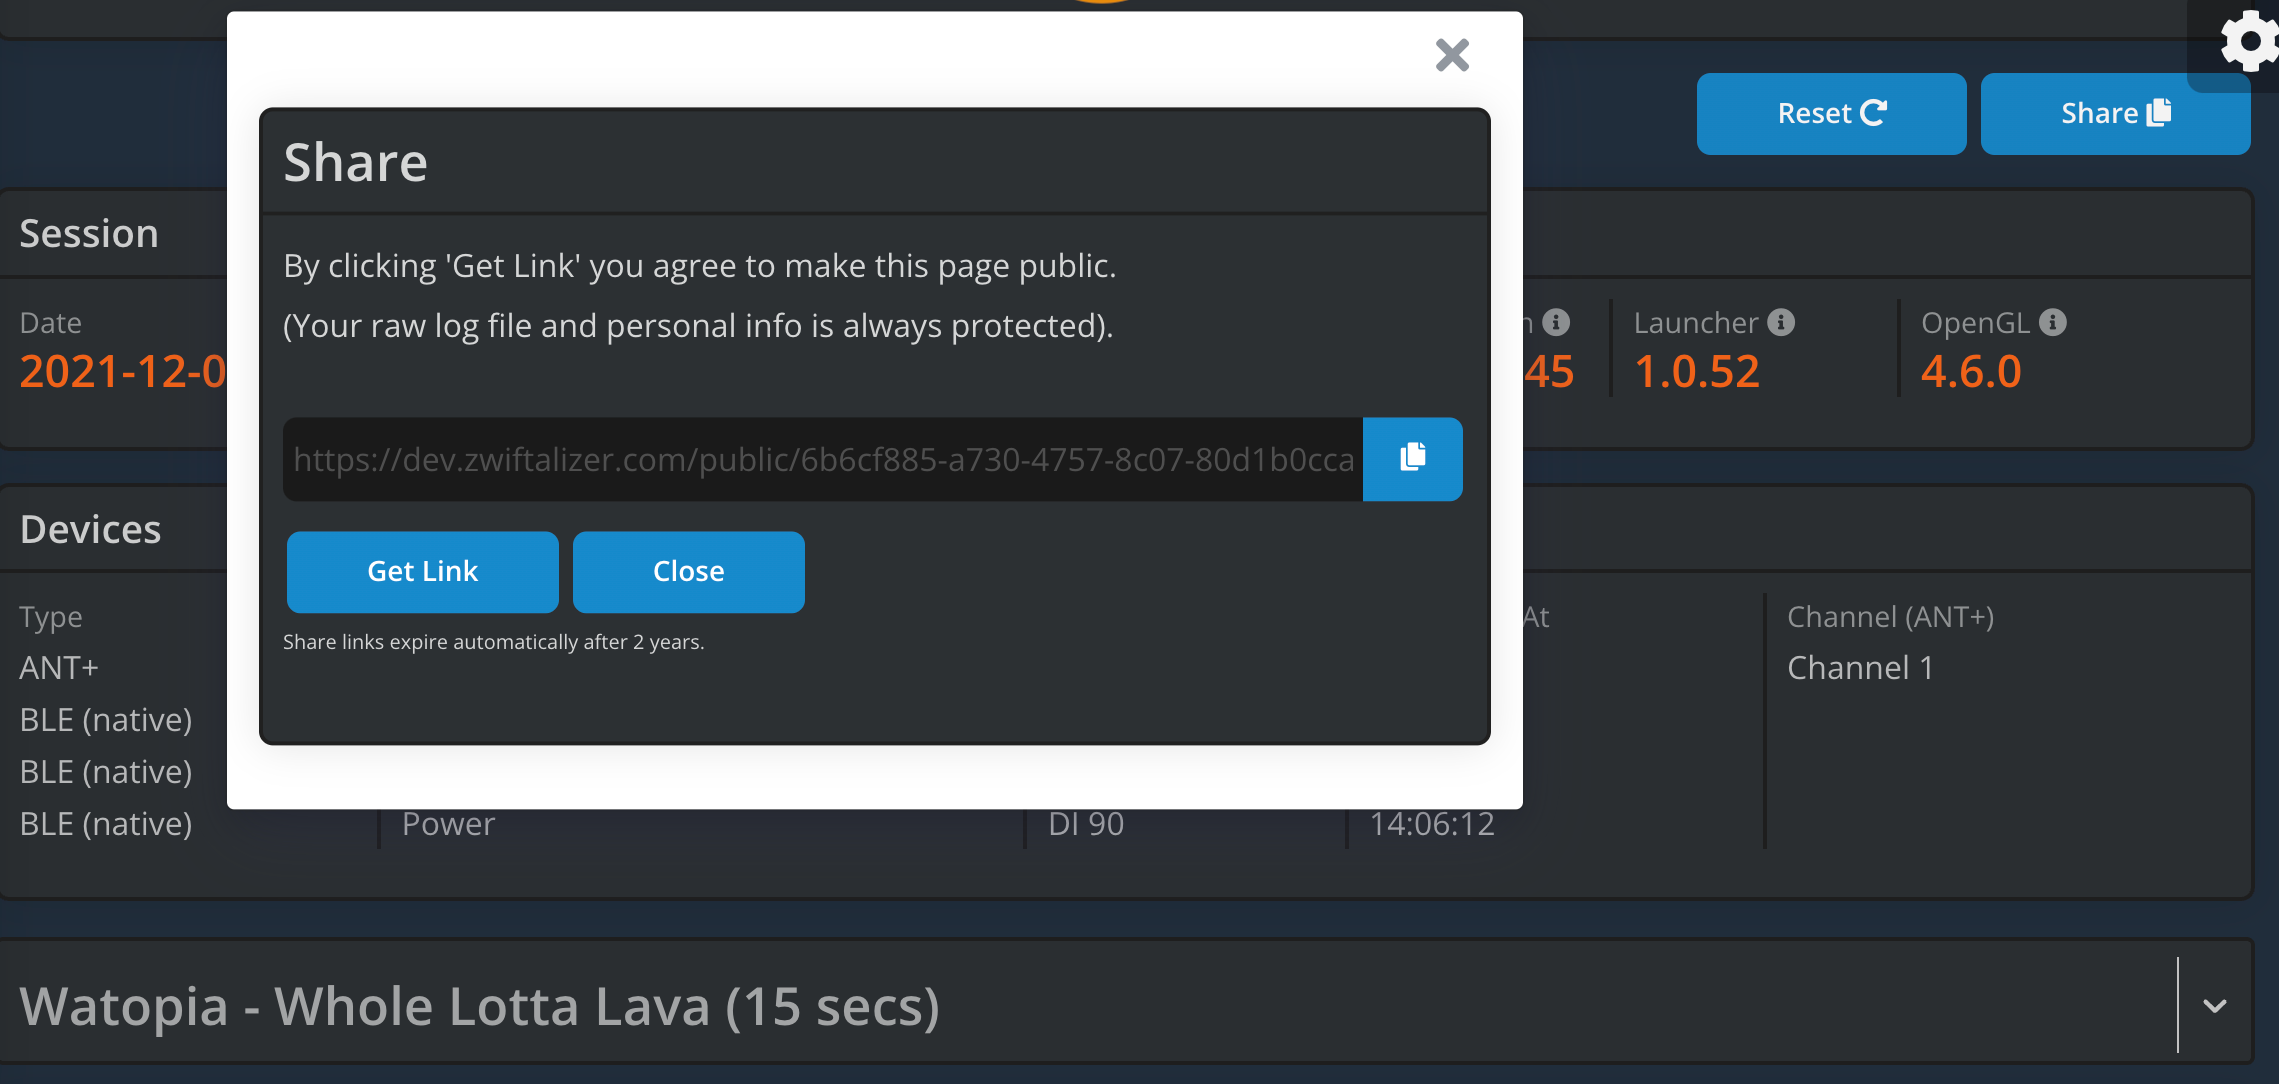
The output of parsing a log can now be shared with anyone. This is to allow users to conveniently post links in the Zwift Forums and social media channels that link back to Zwiftalizer without having to take screenshots. It is important to note that raw log files are never made public.
Benchmarks For Each World
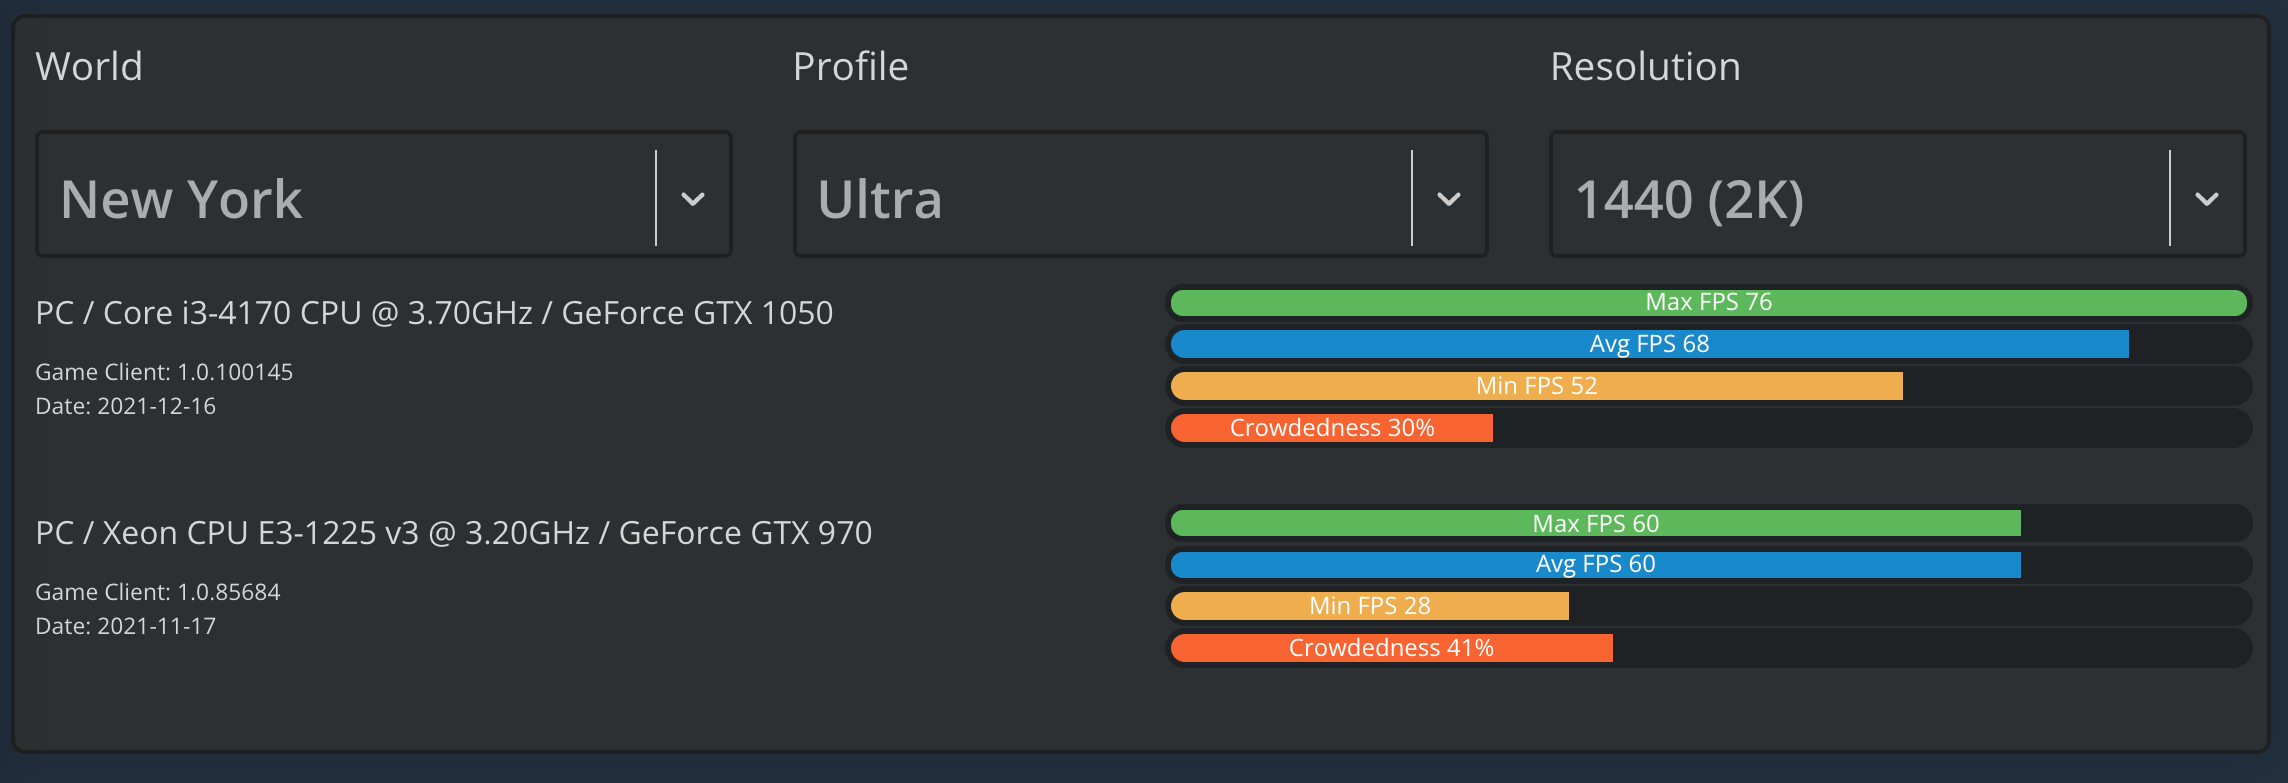
Multiple activity parsing facilitates the next big change - benchmarks for each world. Users have been asking me for this for years. Graphics performance for the older Worlds like Watopia and London is much better than on the newer worlds like New York and Makuri Islands. This is logical since the newer worlds are considerably more complex. Now, the community can see just how much performance differs across worlds. Interestingly all worlds perform about the same on modern Apple ARM CPUs found in phones, tablets, and Apple TV - 30 FPS at 1080 resolution, basic profile, but the visuals are nowhere near as rich as a discrete GPU running at 4K resolution and ultra profile. This interests me a lot because I feel the business is prioritizing development for the mobile and consumer device userbase and de-prioritizing PC and Mac users, which I can totally understand from a business resource planning and ROI perspective, but don’t agree with.
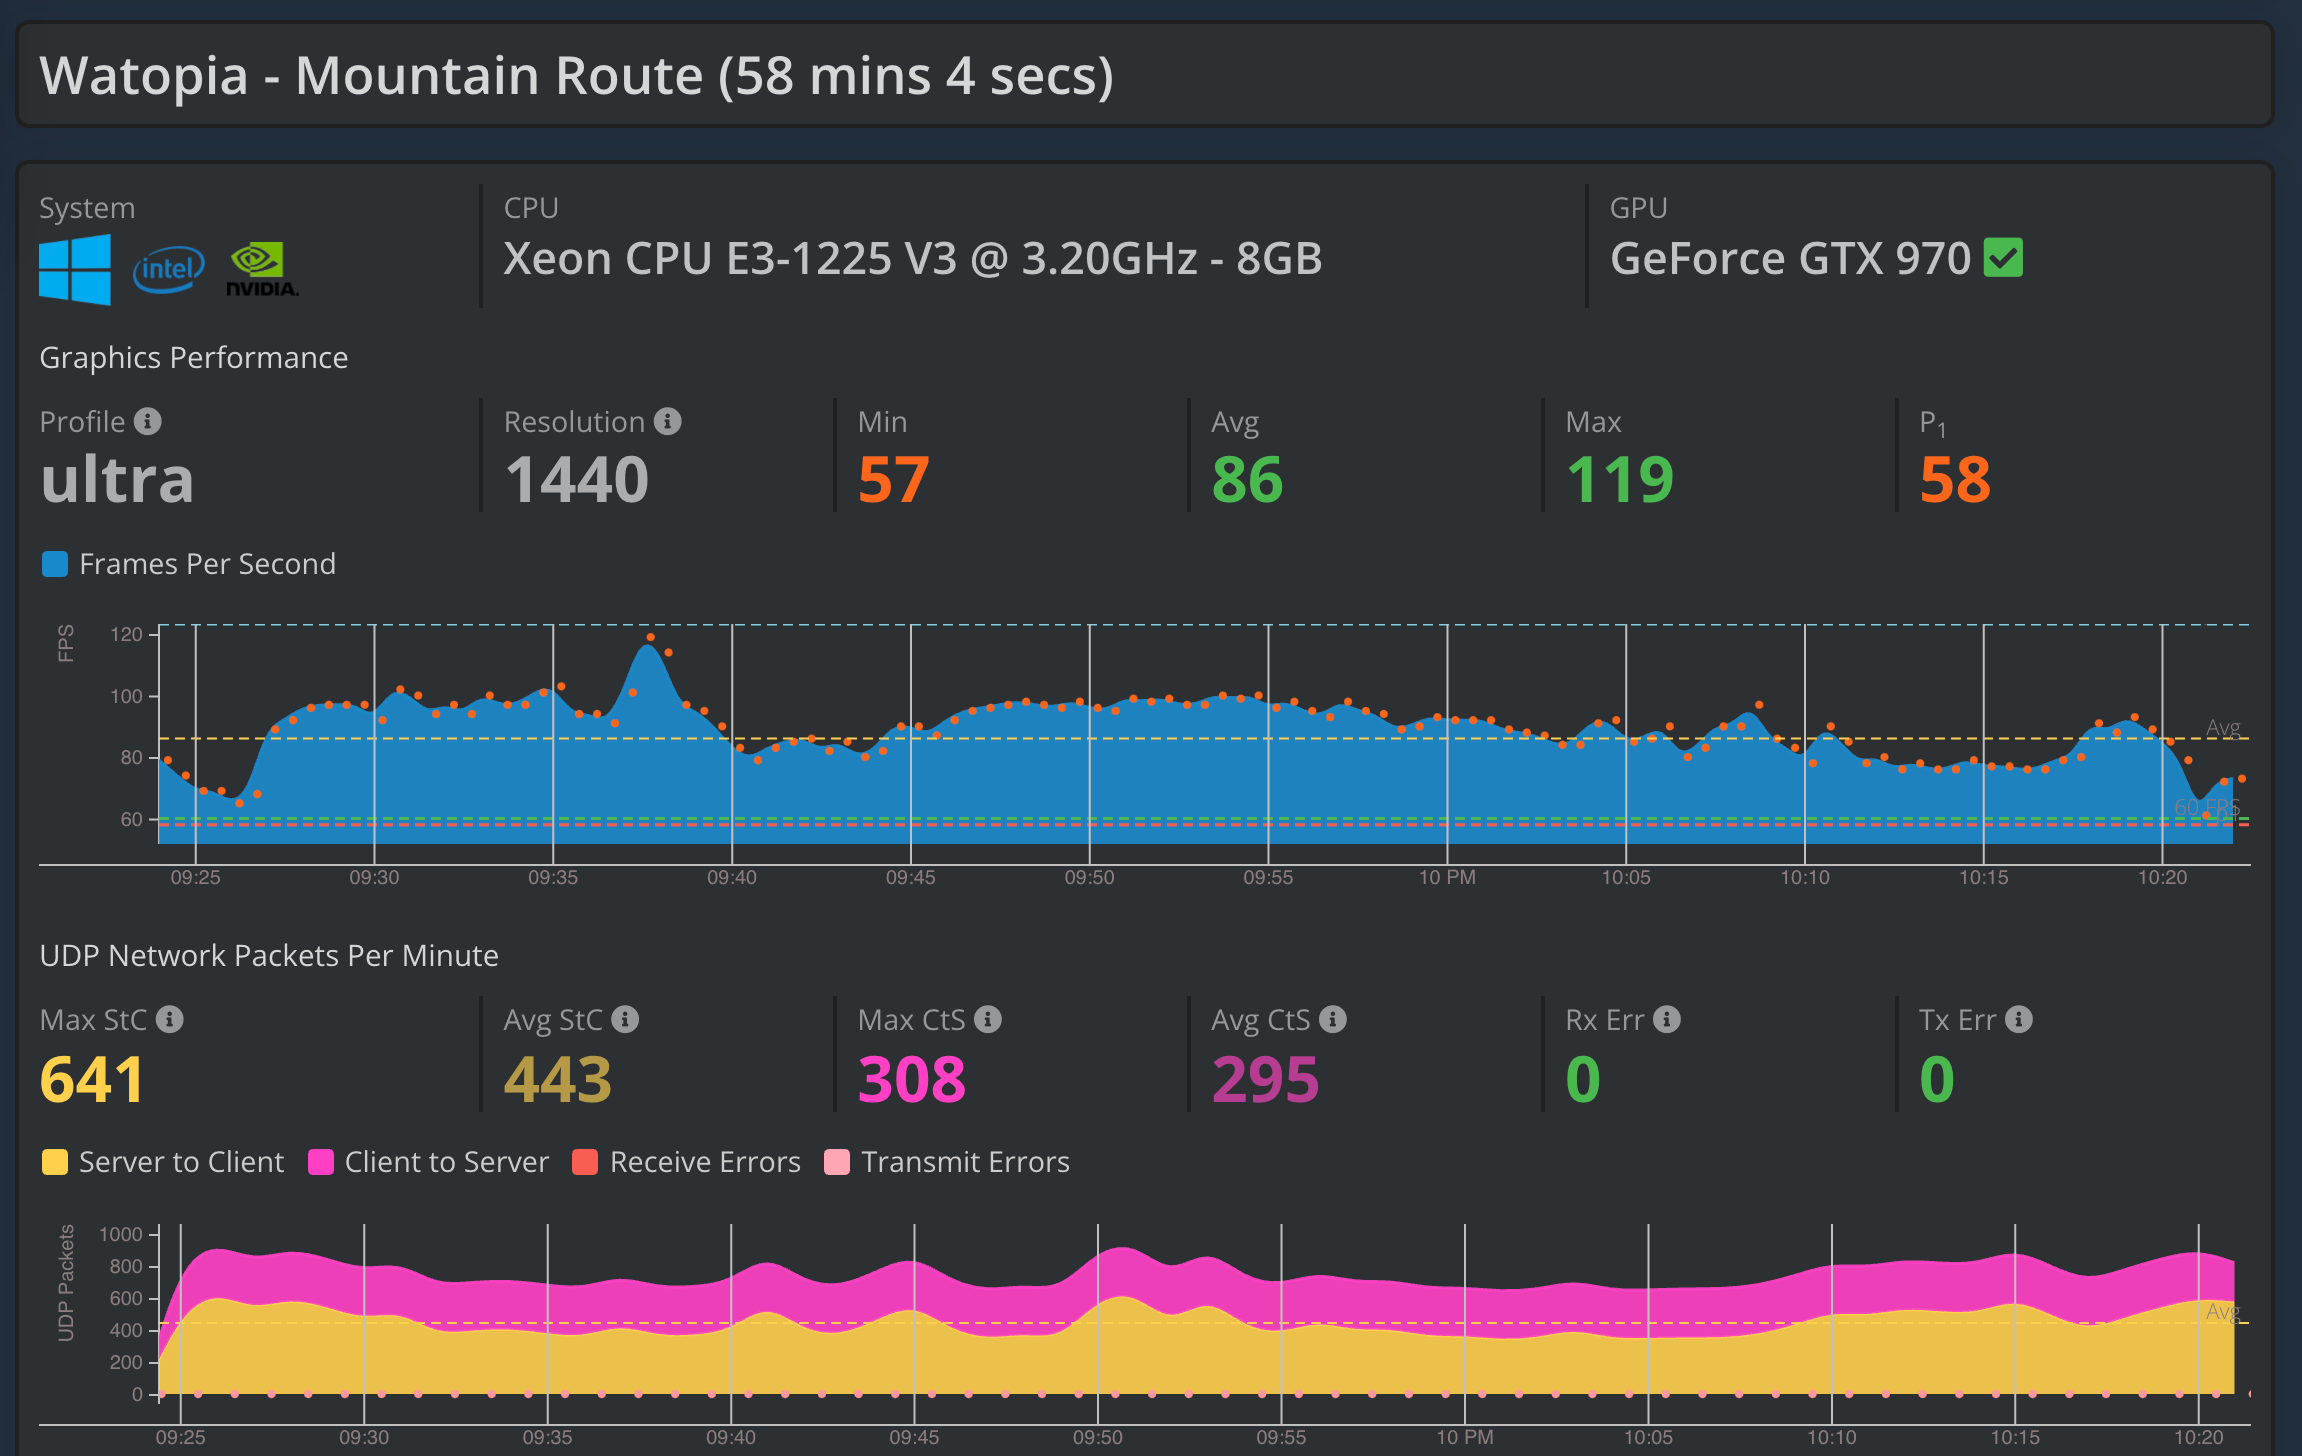
UDP Network Data
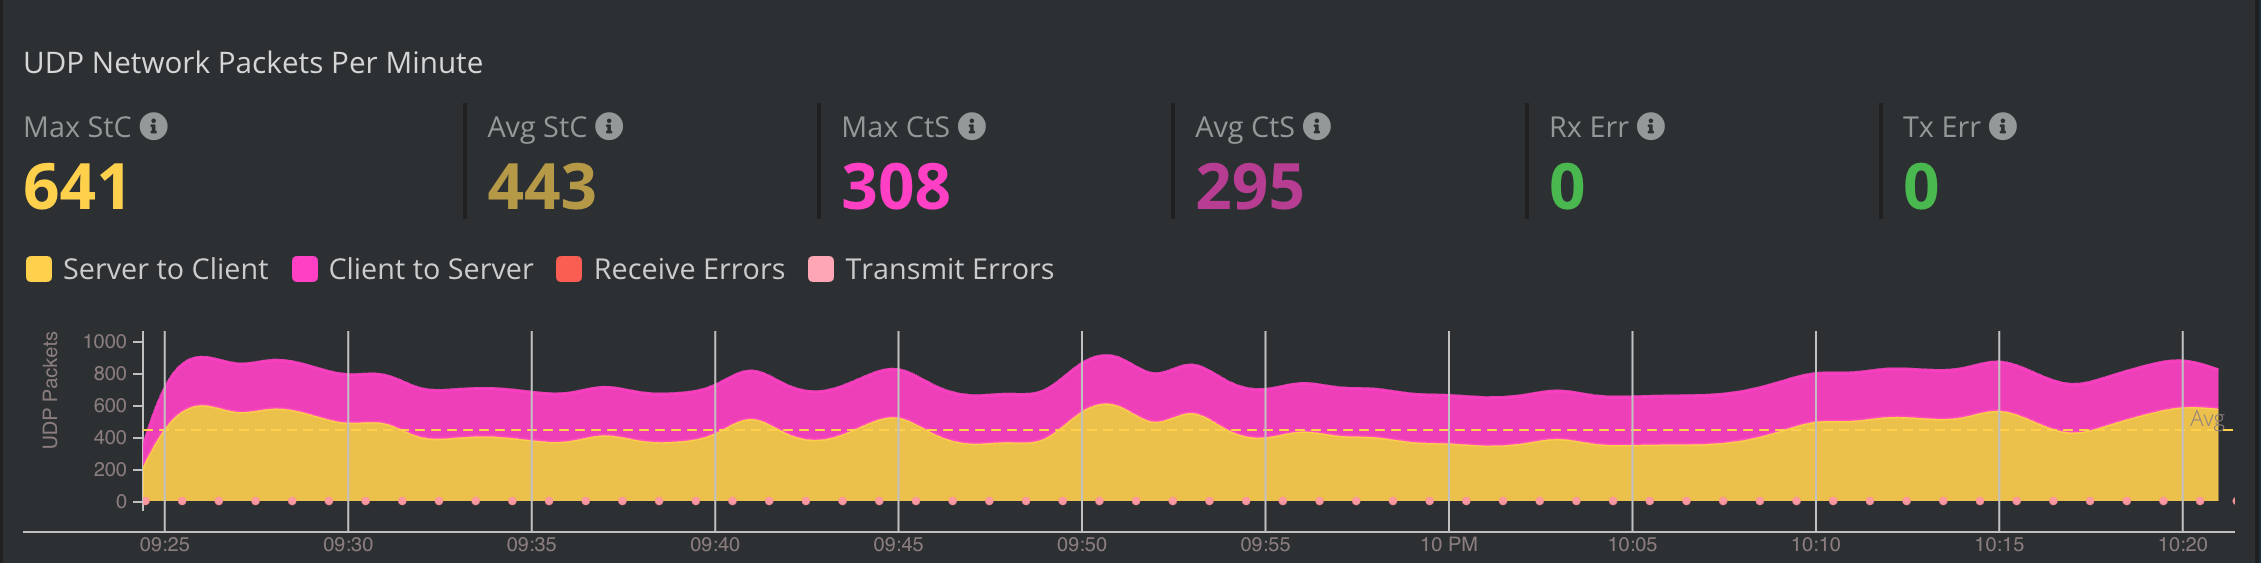
The third biggest change is the addition of UDP network data charts. I noticed UDP data showing up in the log file sometime in early 2021. Being able to visualize UDP packet count alongside FPS confirms something I’ve assumed for a while - that when you’re riding in a large group, and the volume of UDP server to client packets per minute increases, FPS tends to decrease proportionally. For most people, this isn’t noticeable. But folks who expect a consistent 60 FPS 4K experience from their high-end GPU, and don’t understand why they aren’t seeing it, might want to upgrade their CPU because decoding all that network data is a CPU-bound task, not GPU. Rendering 100 riders is no sweat for a GPU, but knowing where to render them is critical for an MMOG and completely CPU-dependent.
Ping Test
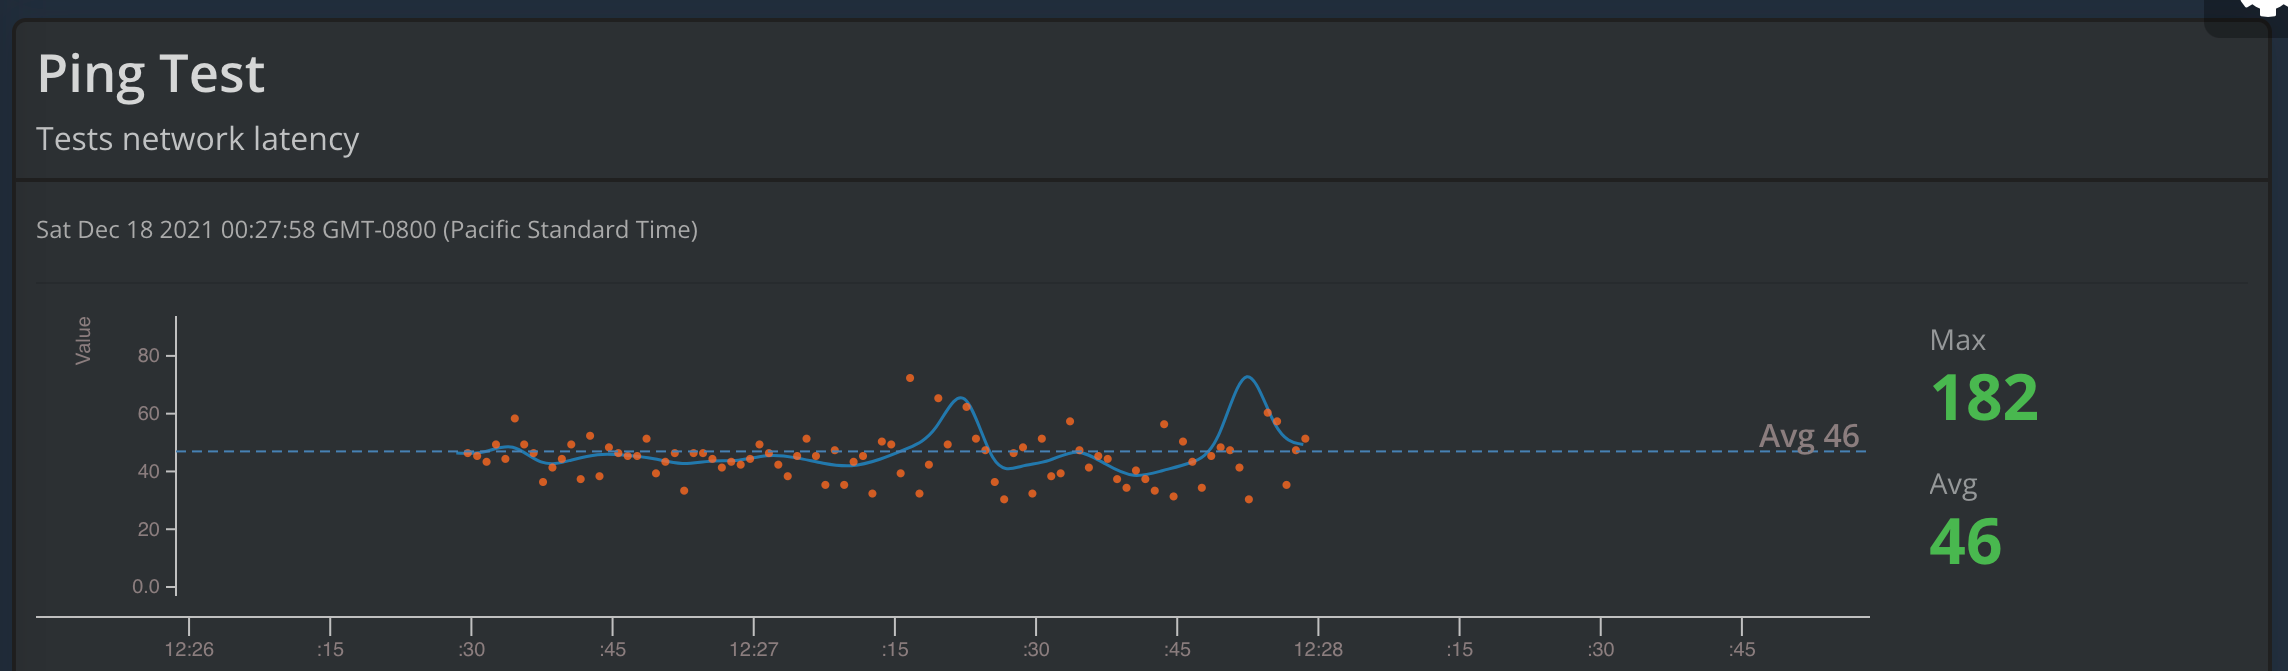
This leads me to the 4th change - Ping test. The motivation for this feature is to provide a convenient, self-service way for a user to visualize their Internet connection quality to the AWS us-west-2 region. Why is this relevant? A consistent round trip time is important for smooth motion in-game. Consider this scenario - you are in Singapore connected to Zwift’s servers in AWS’s West coast data center halfway around the world, and I am in Seattle 150 miles away as the crow flies. It takes 210 milliseconds for you to receive the same packet of information that I get in 30 milliseconds. Similarly, it takes 210 milliseconds for the server to receive your latest position, compared to my 30 milliseconds. But, and this is critical, the data refresh interval is the same for both of us. So the latency is not a big deal because the game engine (probably) compensates for our latency differences and normalizes everything to a central clock (the server time and local client time is sent in every data packet).
Now, what if your network latency is highly variable - 210 ms, 450 ms, 560 ms, 360 ms, etc? Your latest position may be beyond the acceptable range for compensation. What would be the outcome? I’m speculating, but I think you would pop in and out of position as my client assumed your position and then had to reposition you when the next good position was received. I believe this repositioning motion is smoothed out by my client, but I assume there are limits to how often this can be done for every single rider around me, and at some point, it drops you back in abruptly. Therefore, consistent round trip time values in the Ping test are highly desirable. A low number is not that important (we aren’t shooting virtual bullets at each other) but a consistent number is important for smooth sailing.
Summary
Zwiftalizer 2.0 has been rewritten and modernized. It aims to continue to be a useful tool for PC and Mac enthusiasts looking to optimize and troubleshoot their set-ups. Operations and features are subject to change following updates in the Zwift game log format on which it depends.